Built for Marketing Agencies · White-label client reporting
Client reporting for marketing agencies, without the weekly reporting grind.
Upload any campaign export — KashifData returns a full analyst report with KPIs, root causes, a 6-month forecast, and a ranked action plan in under 15 seconds.
✓Share links are created only when you choose to publish a report
🔒Private by default. We process the analysis payload securely, and saved share links are created only when you publish a report.
~15s
Analysis time
4
Analysis types
6
AI models
EN/AR/FR
Languages
Sample Results
Real Reports. Real Results.
Click a sample to see how our AI turns real marketing data into board-ready insights.
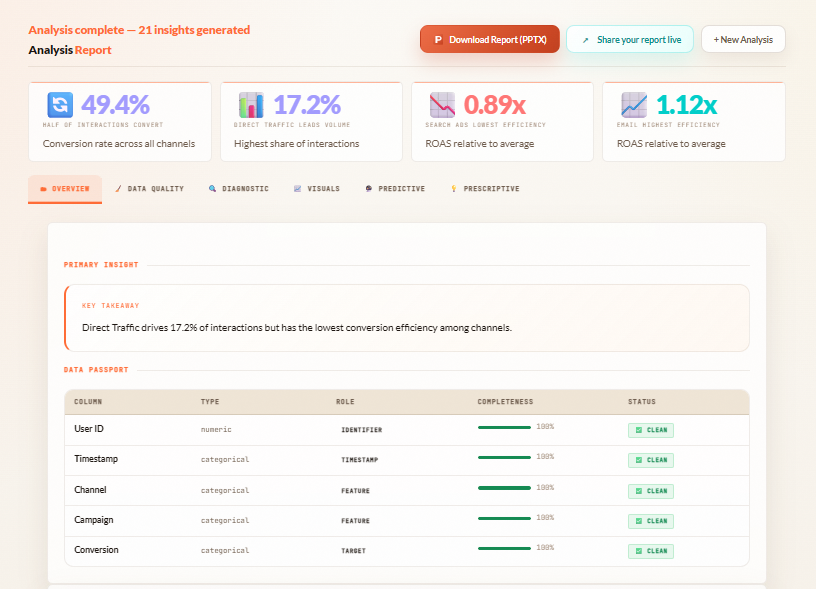
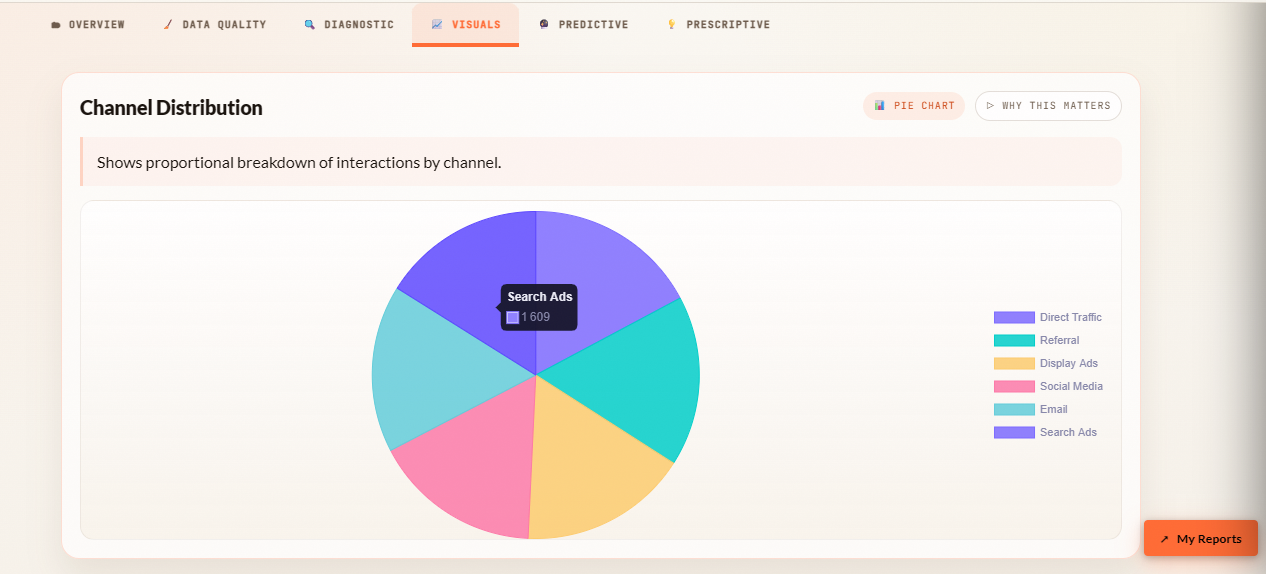
OverviewVisualsPrescriptive
Multi-Touch Attribution Analysis
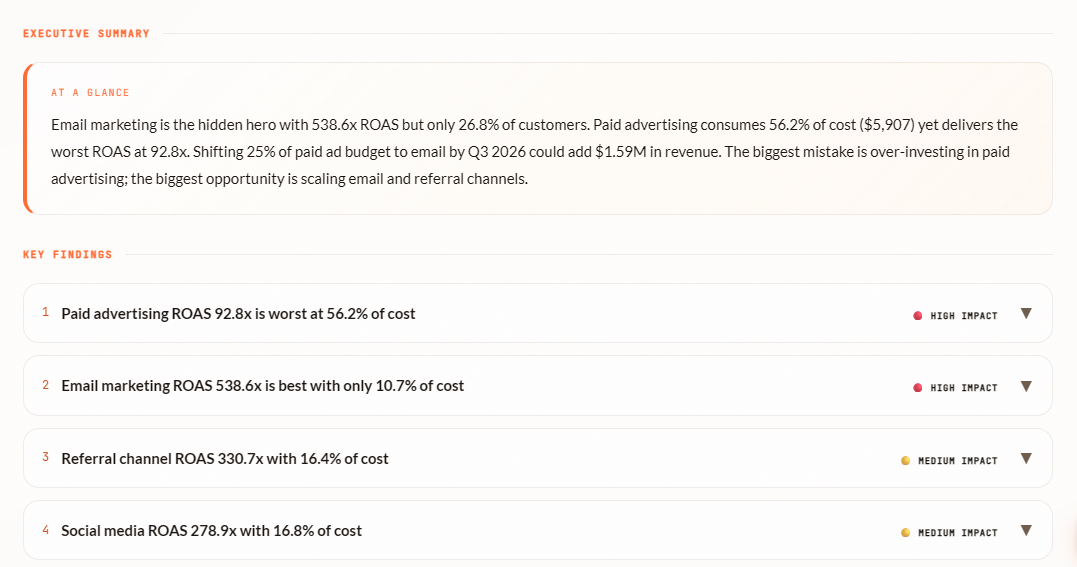
Which channel truly drives revenue? This report breaks down 10,000 conversions across 5 channels — revealing where budget is wasted and where to double down.
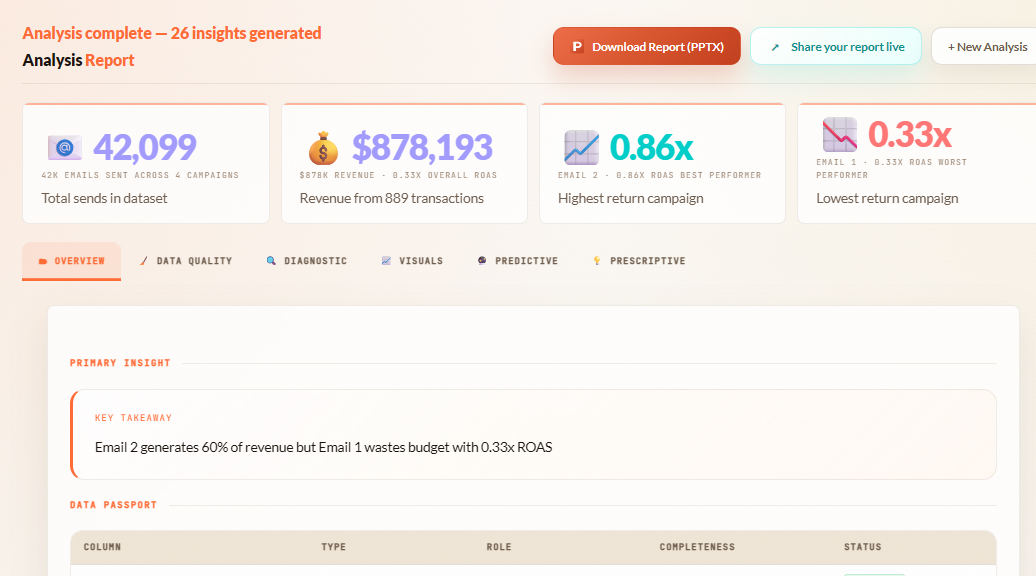
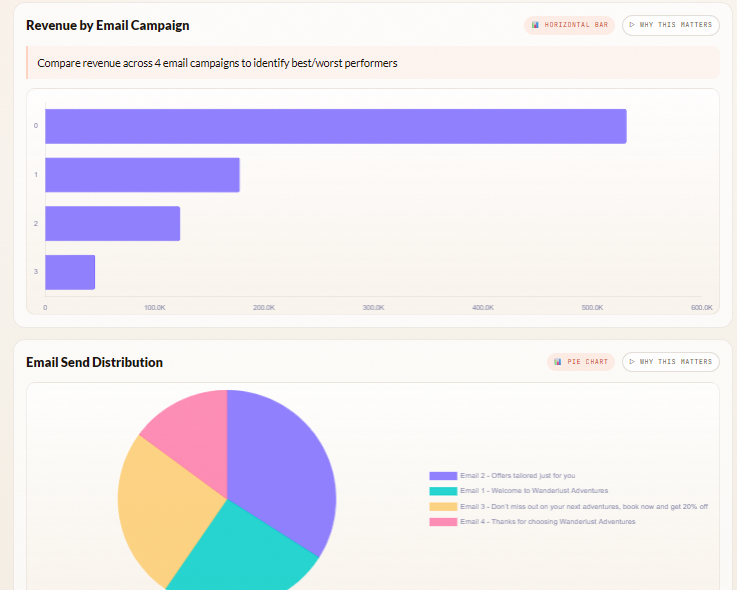
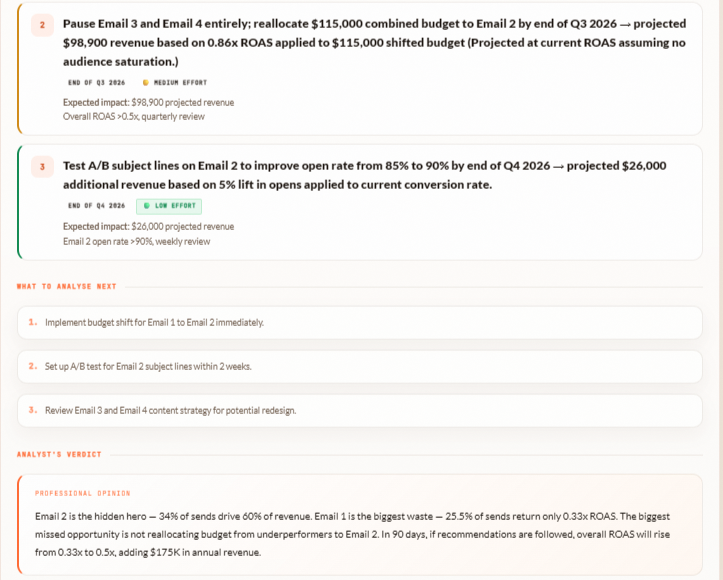
$531K in revenue across 3 campaigns — but one email generates 60% of it with the lowest open rate. The AI finds the hidden hero and tells you exactly what to fix.
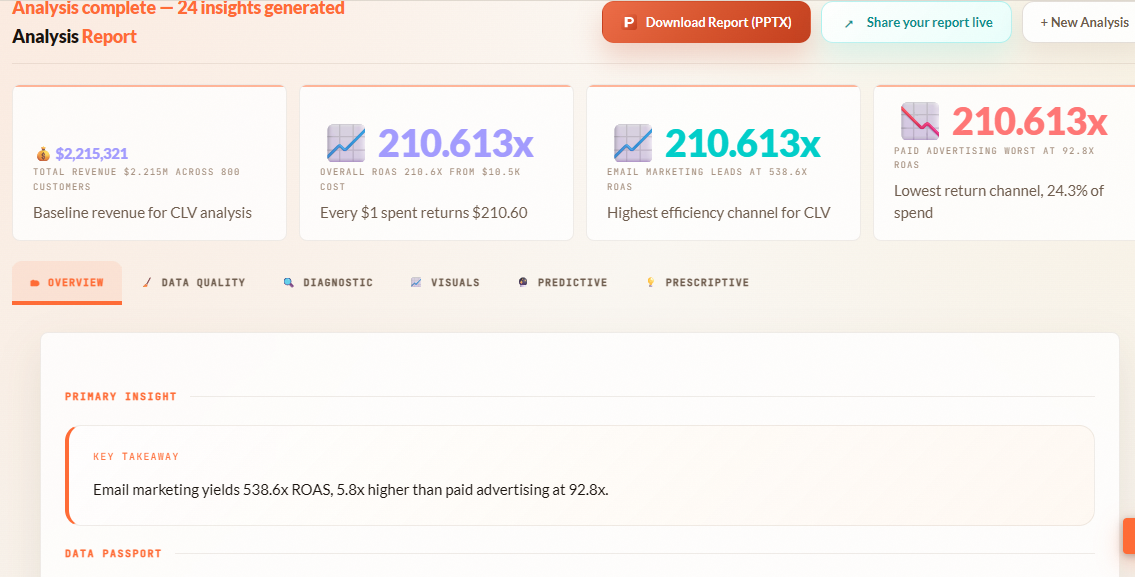
CLV of $210K per customer with a 210x revenue-to-spend ratio. The AI segments your top customers and gives you a ranked action plan to replicate them at scale.
Built for business owners who need answers, not more spreadsheets.
01
📁
Upload your file
CSV, Excel, or JSON — campaign data, sales data, audience data. Drop and go.
02
💬
Ask your question
Tell us what you need: campaign ROI, top channel, audience patterns. Plain English.
03
📊
Get your analyst report
KPIs, root causes, 6-month forecast, and a ranked SMART action plan — in under 15 seconds.
Live integrations
Skip the export. Connect your data.
Pull marketing data straight from your platforms and get a full AI report in seconds — no CSV downloads, no copy-paste.
Live
Google Ads
Campaigns, spend, ROAS and conversions — analyzed the moment you connect.
Live
Meta Ads (FB/IG)
Facebook & Instagram ad performance, pulled live across every campaign.
Live
Google Analytics 4
Sessions, channels and conversions from Google Analytics 4 — no export.
Live
Search Console
Clicks, impressions, CTR and rankings straight from Google Search.
🔒OAuth-secure, read-only access. Disconnect any time.
Analysis types
Four ways to understand your data.
Select one or run all four at once.
📊
Descriptive
WHAT HAPPENED?
Exact metrics, totals, averages across every channel and campaign.
🔍
Diagnostic
WHY DID IT HAPPEN?
Find which channels and campaigns drove results — and which are wasting budget.
🔮
Predictive
WHAT WILL HAPPEN?
Forecast next quarter's performance. Know what's coming before it does.
💡
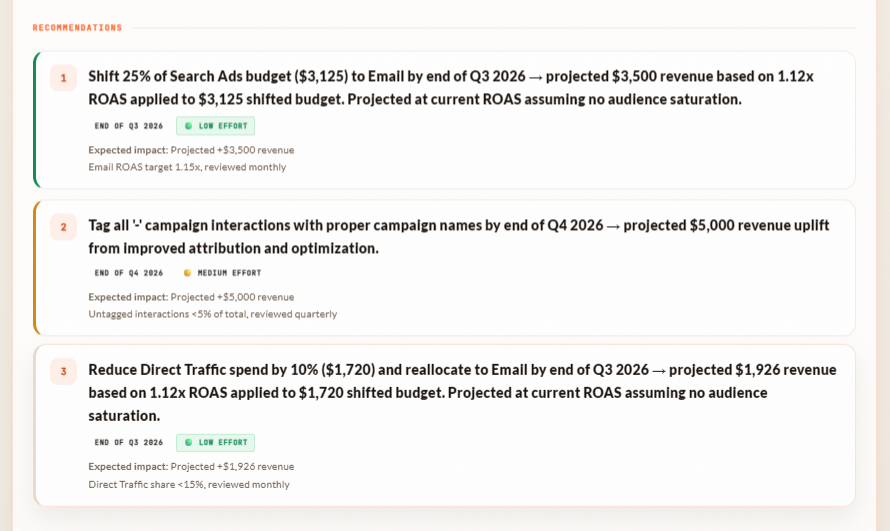
Prescriptive
WHAT SHOULD WE DO?
SMART actions ranked by ROI impact. Walk into every meeting with a clear recommendation.
Share & Collaborate
From analyst to decision-maker in one link.
Generate your report, create a shareable link, send it to your CMO or client. No login required.
01
📊
Run your analysis
Upload your data. Get your full analyst report in 15 seconds.
02
🔗
Create a share link
Choose public or private. Add a password for sensitive data.
03
👔
Stakeholders decide
Your CMO or client opens the report in their browser. No account needed.
🔓
Public links
Anyone with the link views the full report.
🔒
Private + password
Protect sensitive data with a password.
📁
Report history
Every shared report saved — compare quarters.
📊
PowerPoint export
Download board-ready slides, not static PDFs.
Built for Marketing Teams
Your 24/7 data analyst.
From raw campaign data to board-ready insights — no formulas, no waiting, no data science degree.
🎯
Full-dataset KPI math
KPI totals and ratios are computed from the full uploaded dataset within your plan limits — not from a small preview sample.
📊
Smart KPIs
AI selects only meaningful metrics. No averaged dates, no ID calculations.
📈
Insight-only charts
Charts appear only when they reveal a real finding.
🔒
Private by default
Analysis runs in secure sessions. Reports are only stored when you choose to create a saved or shared report.
📊
PowerPoint export
Board-ready slides in English, Arabic, or French.
⚡
Fallback safety rails
If a provider response is weak or unavailable, KashifData falls back to validated deterministic output instead of inventing numbers.
Arabic-First Advantage
The only AI analyst built for MENA markets.
Full RTL layout, Arabic-native AI insights, and bilingual PDF reports. Built by a MENA team.
🇺🇸 English
Key Finding: Northwest territory drives 35% of total revenue at $11.9M through Bikes showing 23% higher average order value. Recommend Q4 inventory reallocation.
🇸🇦 العربية
النتيجة الرئيسية: تمثّل منطقة الشمال الغربي 35% من الإيرادات بقيمة 11.9 مليون دولار. يُوصى بإعادة توزيع المخزون في الربع الرابع.
🇫🇷 Français
Résultat clé : La région Nord-Ouest génère 35% du CA total (11,9M$). Recommandation : réallouer les stocks en Q4.